Business Insurance
Keep up to date with market trends and the latest finance news.


Our trusted partner Bionic, has experts who handle the comparison for you and guide you through your quotes.
Compare Business EnergyIn a constantly changing market, locking in a Business Energy deal could be beneficial.

Our trusted partner Bionic, has experts who handle the quote for you and you through your options.
Compare Business InsuranceSecure your business with the right insurance. From contents to cyber, we've got you covered.

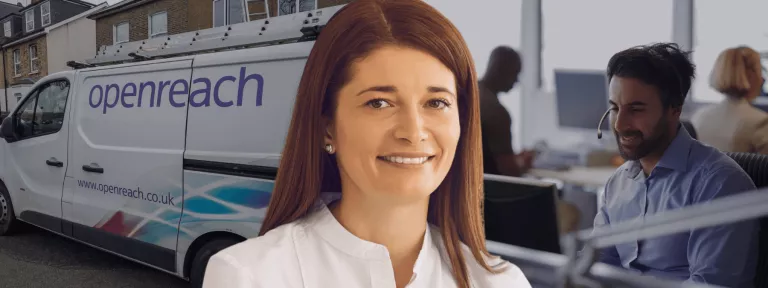
We compare our best Business Broadband deals to find the ideal solution for your business.
Get ConnectedFind everything you need to decide which Business Broadband plan is right for you.

Set yourself up to take (and make) payments easily.
Find our most popular recent guides here.

This article will give you all the guidance needed to help you make an informed decision and switch business broadband providers smoothly and quickly.
How to Switch Business Broadband ProviderKeep up to date with market trends and the latest finance news.
Our trusted partner Bionic, has experts who handle the comparison for you and guide you through your quotes.
Compare Business EnergyIn a constantly changing market, locking in a Business Energy deal could be beneficial.
Our trusted partner Bionic, has experts who handle the quote for you and you through your options.
Compare Business InsuranceSecure your business with the right insurance. From contents to cyber, we've got you covered.
We compare our best Business Broadband deals to find the ideal solution for your business.
Get ConnectedFind everything you need to decide which Business Broadband plan is right for you.
Set yourself up to take (and make) payments easily.
Find our most popular recent guides here.
This article will give you all the guidance needed to help you make an informed decision and switch business broadband providers smoothly and quickly.
How to Switch Business Broadband Provider